CUSTOMER STORY

Connect user experience and application traces across digital services

ABOUT TRANSSION

About the customer

Transsion Holdings designs, develops, manufactures, and markets smart devices and provides mobile internet services. Serving consumers in emerging markets, it continues to develop both devices and digital experiences. Its growing range of users and services makes reliability and ease of use increasingly important.

Smart devices Industry
Devices and services Business focus
Emerging markets Primary market

The challenge

Follow a user report to the service involved

A change in user experience may originate in frontend interaction, a backend API, or a dependency. Transsion needed to connect operational and system monitoring so business and technical teams could investigate together.

Frontend experience, application performance, and logs lacked shared context, interrupting investigations across a single visit.

Operational and technical data lived in separate entry points, making the relationship between business changes and system issues harder to see.

KEY RESULTS

30%

Expected reduction in user-experience issue investigation time

25%

Expected reduction in operational reporting hours

20%

Expected reduction in investigation data preparation hours

SOLUTION

Transsion Holdings × Guance — Solution

01

Connect real user experience with application performance

Collect experience data through the RUM SDK and record backend service calls through APM. Correlating these signals with logs and infrastructure helps teams move from a user-facing symptom to the relevant request.

30%

Expected reduction in user-experience issue investigation time

02

Bring service telemetry into operational views

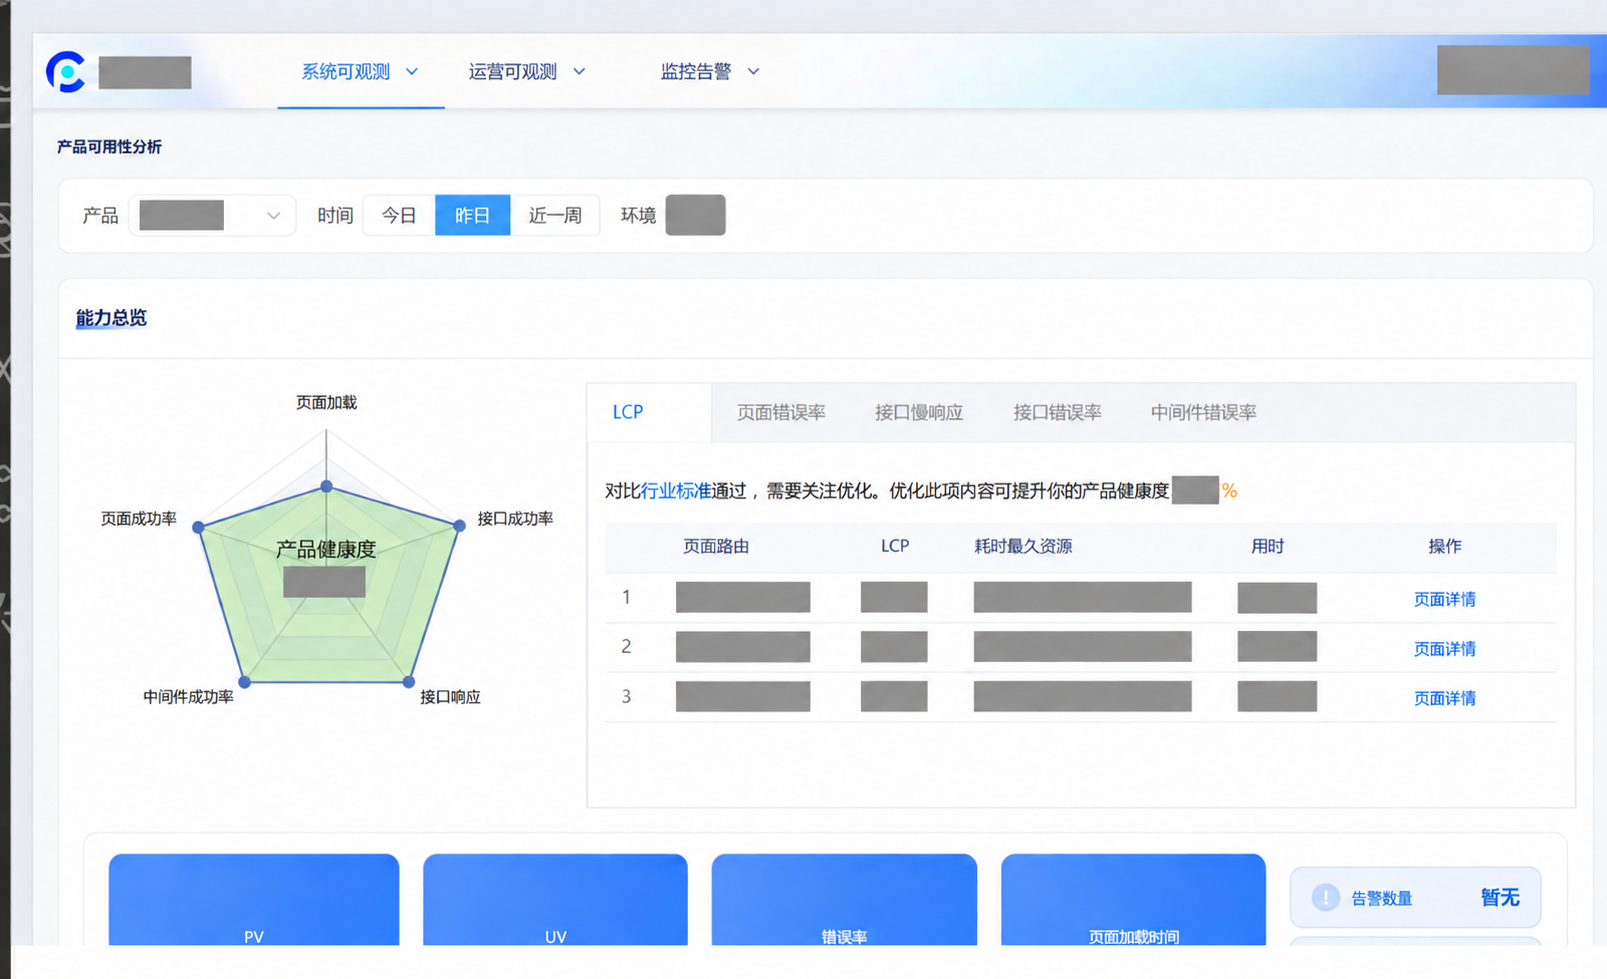
Organize observability data around business scenarios and connect it with everyday operational entry points. Business teams can review service status while technical teams drill into related applications and records.

25%

Expected reduction in operational reporting hours

Product health and performance metrics in the business operations platform
03

Use common queries for correlated analysis

Query system metrics and business data with DQL, then present trends in dashboards. Common time ranges and resource relationships help teams explain issues with less repeated data preparation.

20%

Expected reduction in investigation data preparation hours

BUSINESS IMPACT

Give experience issues a continuous investigation path

01

Connect experience with system state

Teams can follow a user-facing symptom into requests, services, and logs.

02

Keep collaboration in context

A common platform reduces separate searches and helps business and technical teams discuss the same evidence.

03

Support everyday service decisions

Combining system metrics and business data supports ongoing service assessment and follow-up investigations.

Give your business clear operational evidence

Connect user experience, application traces, and business telemetry with Guance.