Yidian Tianxia (Eclicktech) Guance

Unify Kubernetes objects, Java application traces, business logs, and performance metrics

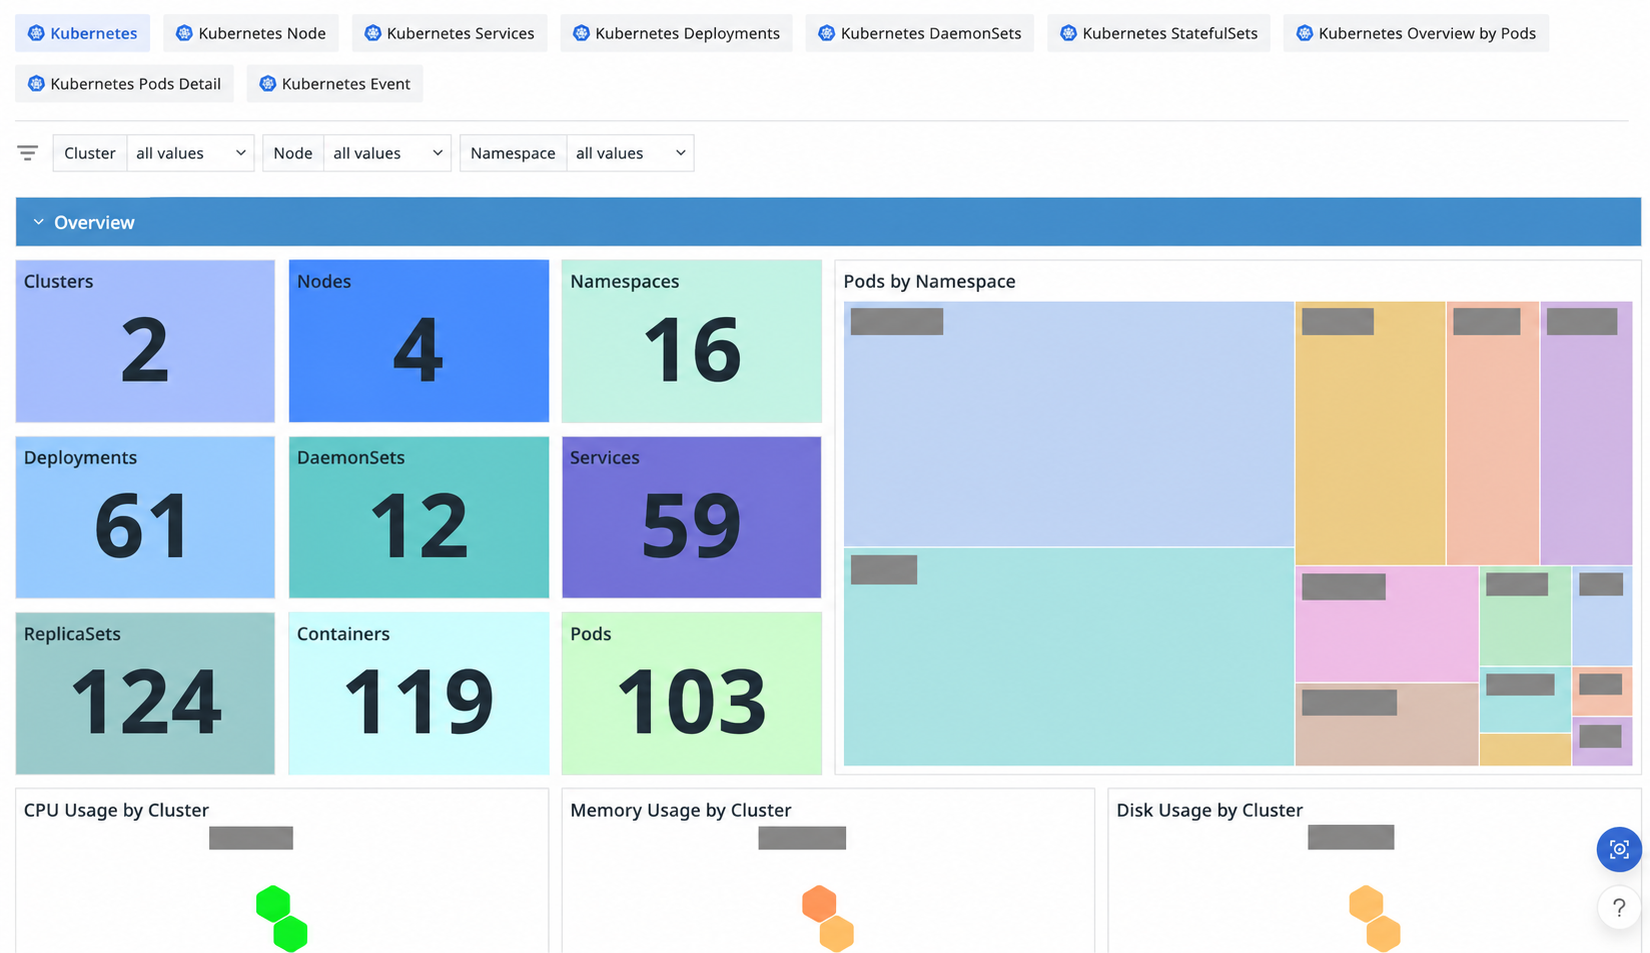
Full-stack Kubernetes monitoring
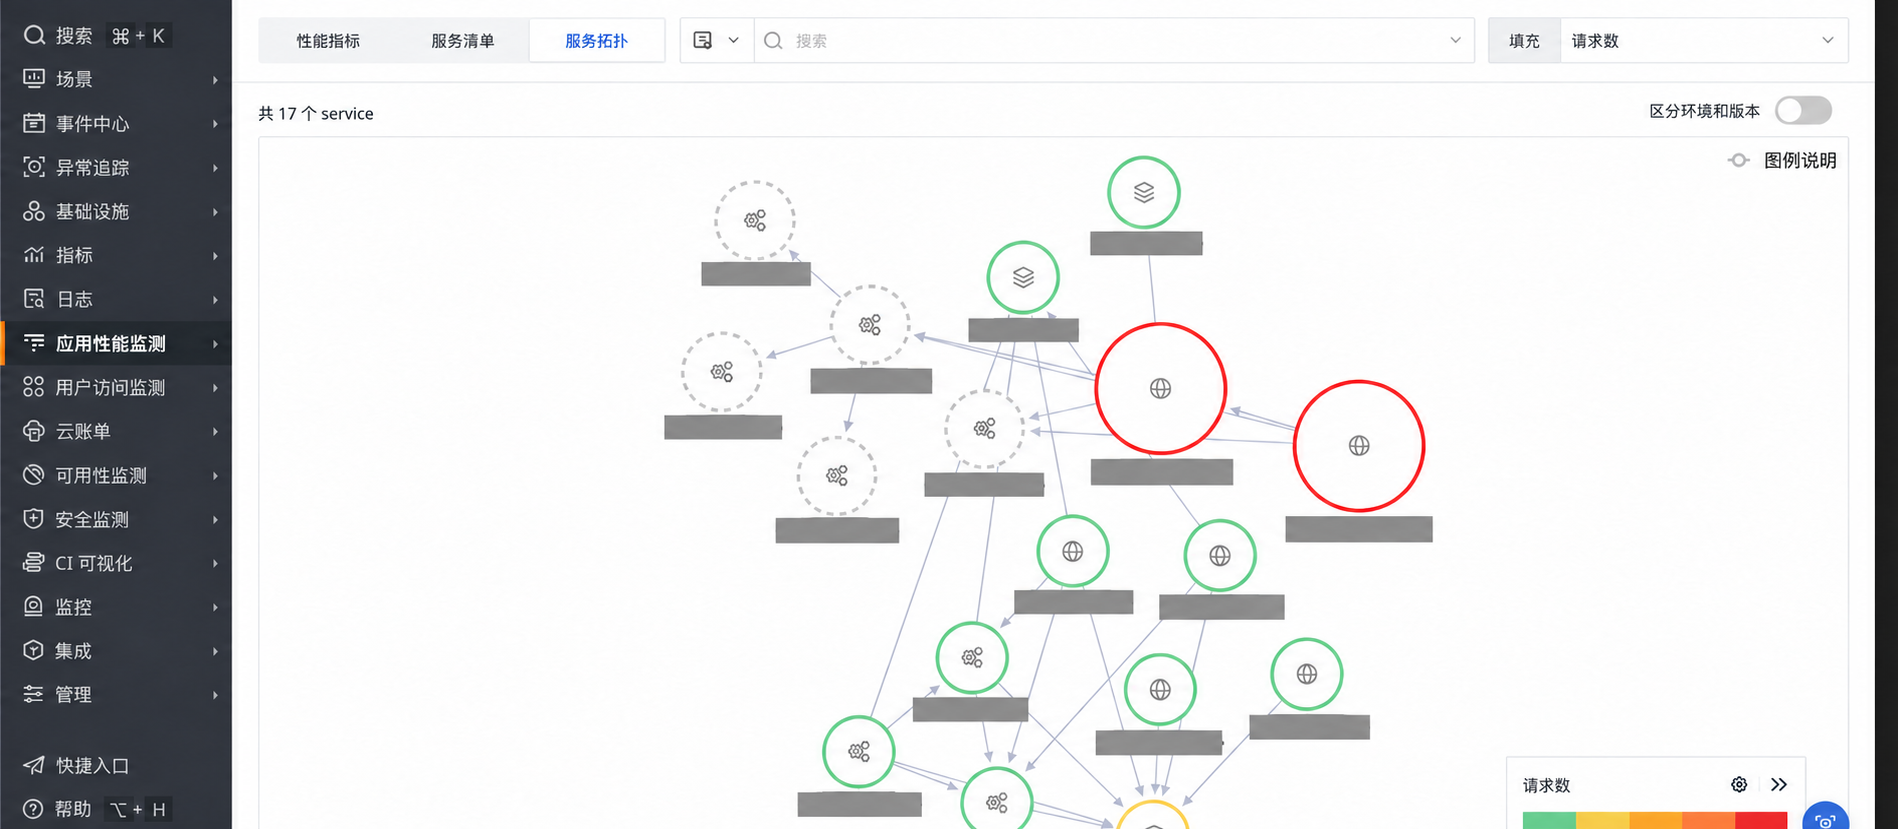
Automatic Java APM onboarding
Trace, log, and metric correlation

Customer context

Yidian Tianxia provides digital marketing and related technology services for companies operating internationally. Its published story describes a growing need to manage complex container infrastructure and application relationships across a global business.

Kubernetes objects changed continuously while traces, logs, and metrics lived in separate tools, leaving performance investigations and service-quality reviews without a continuous evidence path.

Container objects changed continuously

Nodes, containers, Pods, and services required a consistent method for collection, tagging, and relationship-aware analysis.

Container objects changed continuously

Traces, logs, and metrics were isolated

When application performance changed, teams repeatedly aligned services, instances, and time windows across tools.

Traces, logs, and metrics were isolated

Customer workflows increased reliability pressure

A platform incident could affect customer campaign and operating workflows, so the team needed earlier signals and traceable impact context.

Customer workflows increased reliability pressure

Implementation

Create a unified observability workflow

Container, application, and business signals entered one platform for analysis by service, environment, and time window.

Create a unified observability workflow

Collect Kubernetes data with DataKit

DataKit collected metrics and logs for Kubernetes nodes, containers, and services, using object tags for filtering and correlation.

Collect Kubernetes data with DataKit

Onboard Java APM and correlate signals

The published story describes DataKit automatic Java injection for APM, with application traces correlated to business logs and performance metrics.

Onboard Java APM and correlate signals

What changed

Investigations retained object context

Teams could follow a service call into related logs, metrics, and container objects to narrow the affected area.

Dashboards connected signals to operating decisions

Multidimensional data could support views of service health, anomaly trends, and architecture behaviour.

Container monitoring became more consistent

Shared collection and tags reduced duplicate maintenance across container monitoring and application investigation workflows.

Frequently asked questions

What Kubernetes scope appears in the Yidian Tianxia story?

The published story names metrics and logs for nodes, containers, and cluster services. Actual coverage depends on permissions, collector settings, and retention policies.

What does automatic Java APM onboarding provide?

It reduces per-application setup and adds request context for latency, errors, and backend-service performance. Compatibility and sampling still need validation before production rollout.

Why correlate traces, logs, and metrics?

Traces show the request path, logs carry errors and business fields, and metrics show service and resource trends. Correlation keeps one service and time context across the investigation.

More customer stories